Overview
This article gives my interpretation of why traditional classifier suppresses the (fully-connected) neural network if the input features are given.Introduction
To recognize certain objects from an image, a lot of research use the Convolution Neural Network (CNN) to extract features and then input those features to the traditional classifier to predict the result. This still holds even if the data sets are large enough (i.e. the effect of overfitting can be excluded).It's hard to believe though, since the CNN is trained for such purpose and the last layer (such as the fully-connected layer or the softmax layer) is optimized with others as a whole. Namely, during training, each layer will adjust their parameters so that they can give the best result. In this situation, the former layers will extract features that best work with the last layer who performs the classification. And the last layer is especially designed for accepting those kinds of features and do the classification.
However, there're plenty of papers use the traditional classifier to give the final results. And even the SVM (which is regarded as the simplest classifier and it's trivial version can only separate the data linearly) is considered better than the fully-connected layer. Besides of the cause of overfitting (the data is too few compare to the parameters to fit), following is the interpretation I proposed.
Interpretation
Suppose we take 2D feature space to describe a system:1. If the distribution of data looks like Fig. 1(a), it is very simple to separate it into two classes.
(All of the following graphs are all calculated by libsvm)
Fig. 1 (a) (b)
(b)
 (b)
(b)
2. If the distribution of data looks like Fig. 2(a), it still makes sense.
Fig. 2 (a) (b)
(b)
For example, the horizontal axis represents the BMI of students, and the vertical axis is their sports performance. This distribution can also be perfectly separated by SVM if a certain transformation is performed on the two axes. For example, if you transform the BMI ratio to some score that represents the health of human body, the graph will look like Fig. 1 (which means "health score" is more suitable to describe such system). (b)
(b)
3. If the distribution of data looks like Fig. 3(a), some red dots that surround by blue dots may be noises (i.e. data that is mistakenly labeled). You know you want your algorithm to separate your data and gives the result like Fig. 3(b). However, if your algorithm makes a fuss about such noises it would look like Fig. 3(c). If this is the case, it will drag down the performance.
Fig. 3 (a) (b)
(b)
 (b)
(b)
(c)

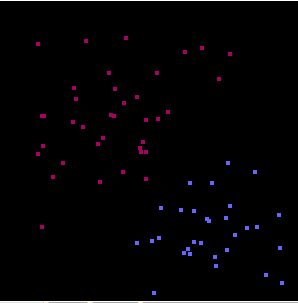
4. If the distribution of data looks like Fig. 4(a), this feature space may make no sense in my opinion. This probably means this feature space is not adequate to describe such system. If your algorithm tries hard and tends to separate these data into many small groups, it probably does it wrong.
Fig. 4 (a) (b)
(b)
In this case, you should probably abandon one of the features (or even both of them). Or, find new features that describe the system well by setting some restrictions of your model (such as Regularization). This may also be able to explain why Clustering can't give a better result than SVM: Although the parameters of Clustering is quite a few (compare to the input data), trying to separate every data well is meaningless. (b)
(b)
Now, let us back to the high dimension feature space. If your algorithm has many parameters that can fit into many circumstances (such as the fully-connected neural network), no matter current data is a noise or some of the features are poor to describe the system, it may get into trouble. Instead, if one algorithm that can ignore some noises and take less of those features which does not help to classify objects, it may give a better result.
沒有留言:
張貼留言